Track Notify me engagement
Use this guide to see how shoppers move through your Notify me funnel, from a first impression on the product page to a signup. By the end, you'll be reading the Engagement view under Reports > Back in stock > Products, and filtering and sorting it to find your best and worst performing products.
Before you begin
The Engagement view requires STOQ's analytics pixel. Until it's turned on, the view shows a preview using sample data instead of your store's numbers.
Open the Engagement view
Open the Products tab
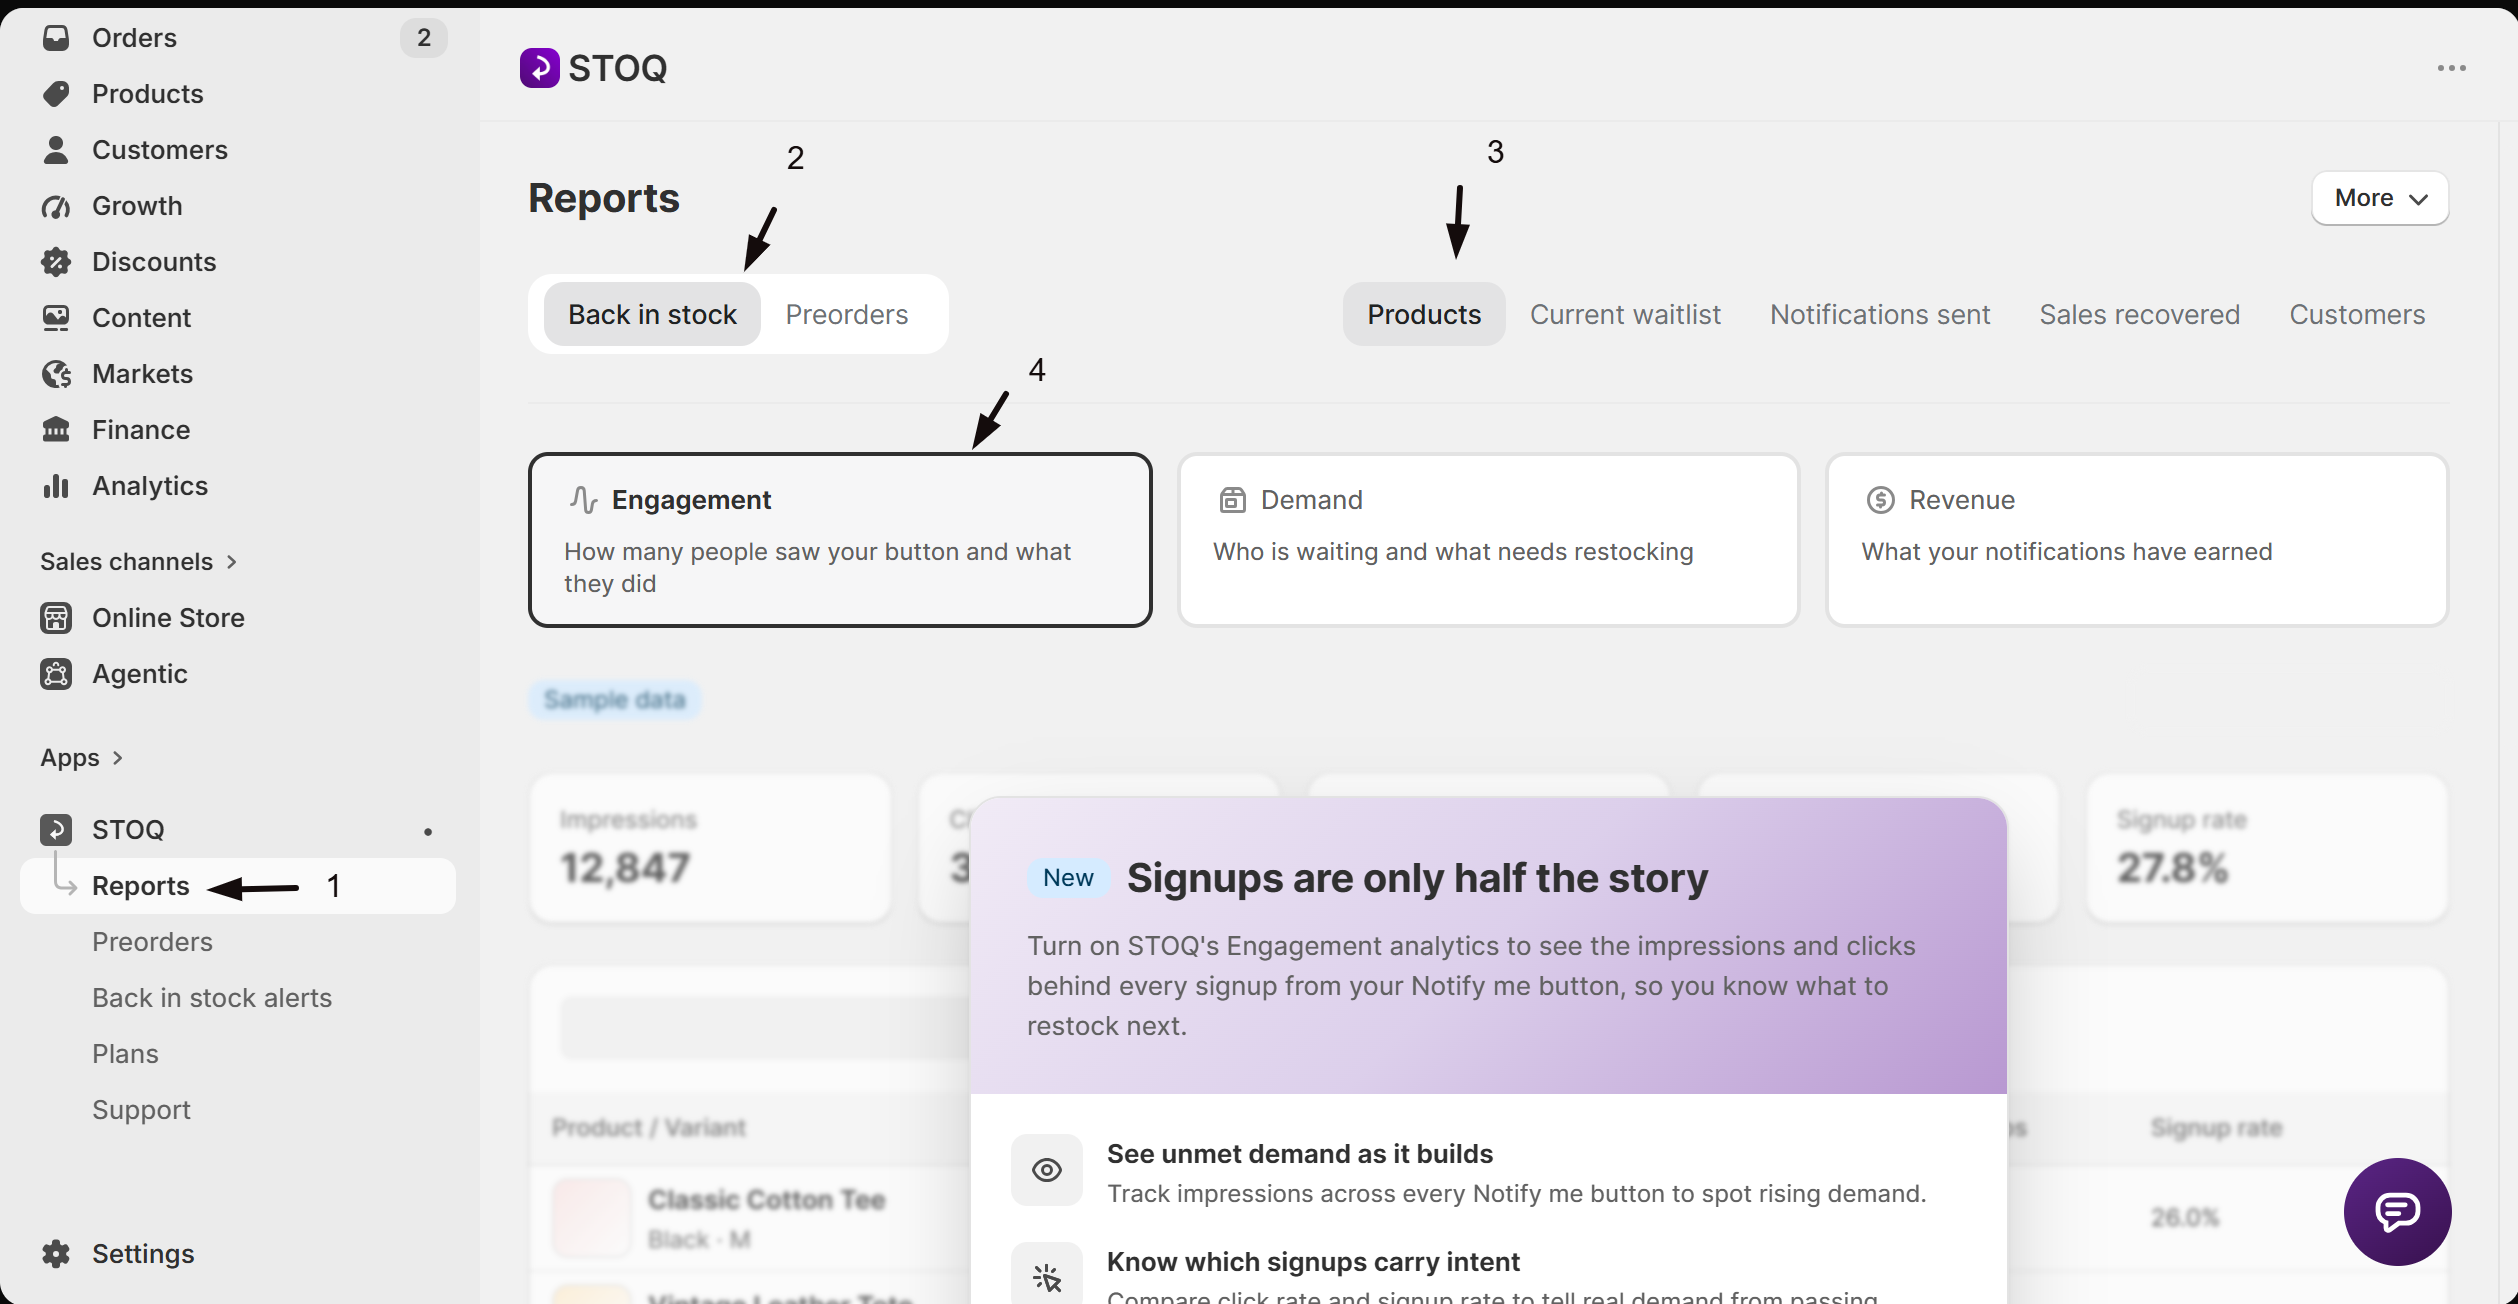
- In the left menu of the STOQ app, click Reports.
- Click the Back in stock tab at the top.
- Click the Products sub-tab.
Switch to the Engagement view
At the top of the Products tab, click the Engagement card, next to Demand and Revenue. It's marked with a New badge.
Turn on analytics
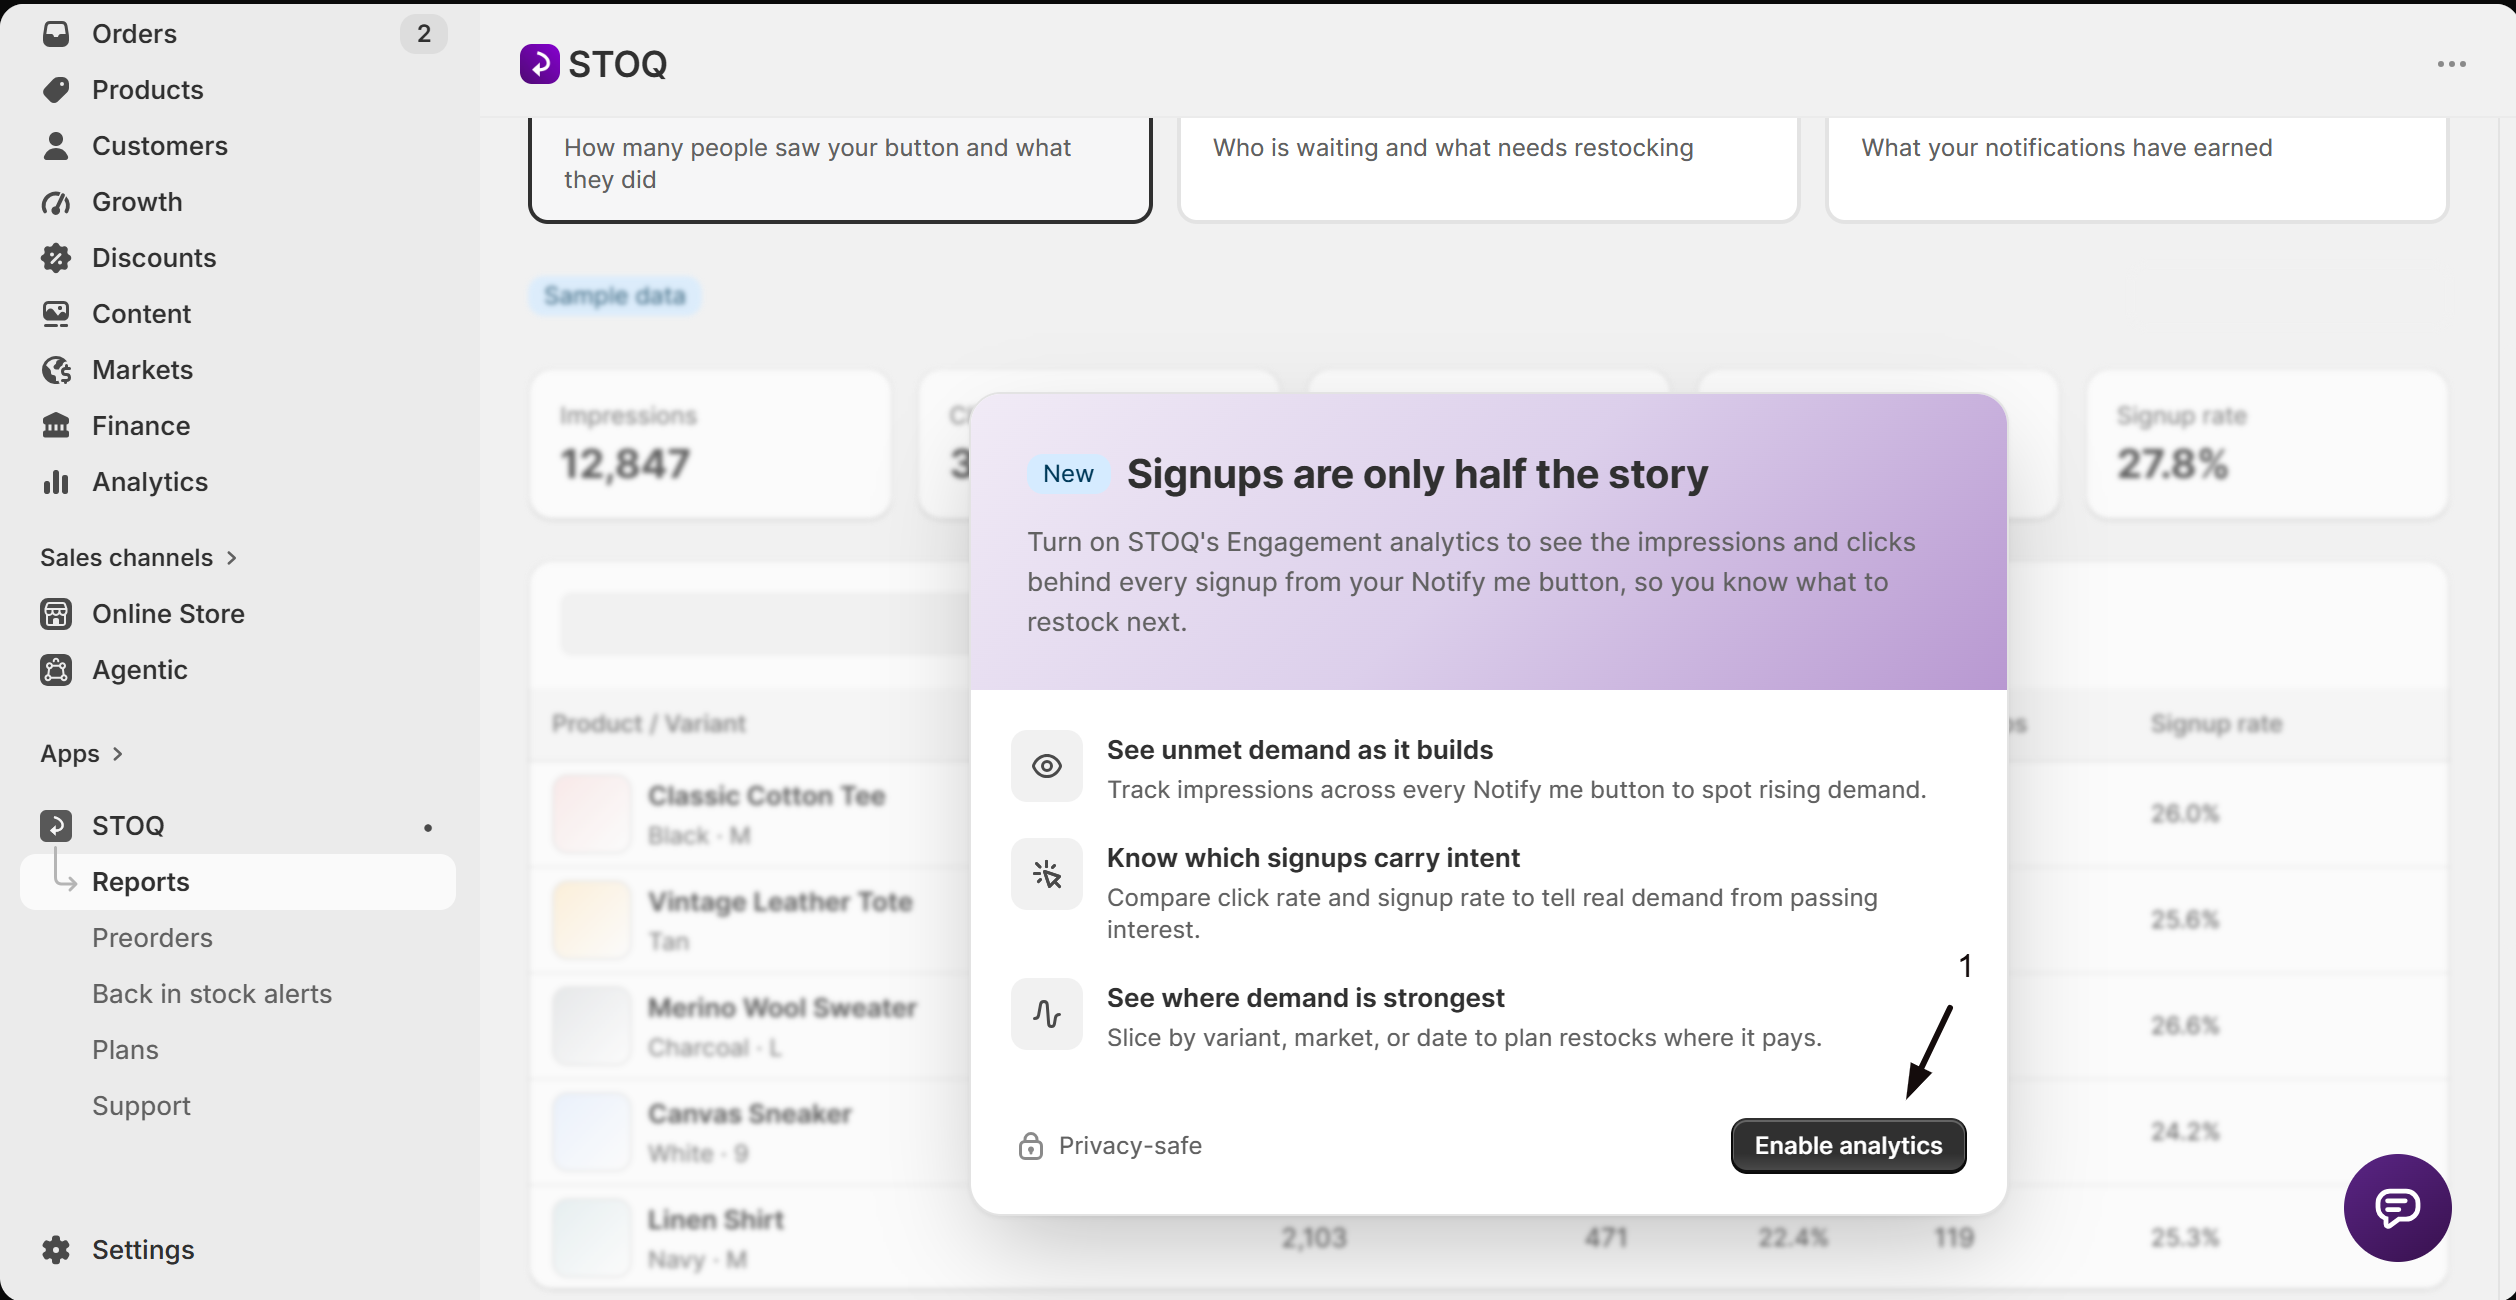
If the pixel isn't active yet, the Engagement view shows a blurred preview marked Sample data, behind a card headlined "Signups are only half the story." The card lists what turning it on unlocks:
- Track impressions across every Notify me button to spot rising demand
- Compare click rate and signup rate to tell real demand from passing interest
- Slice by variant, market, or date to plan restocks where it pays
Next to the Privacy-safe label, hover the lock icon for details: events are captured through Shopify's Customer Events API, and STOQ records button impressions, clicks, and submissions, not personal data.
Click Enable analytics to turn it on. STOQ reloads the page once it's active; real numbers start appearing as shoppers use your Notify me button, so give it some time before you check back.
Read the funnel
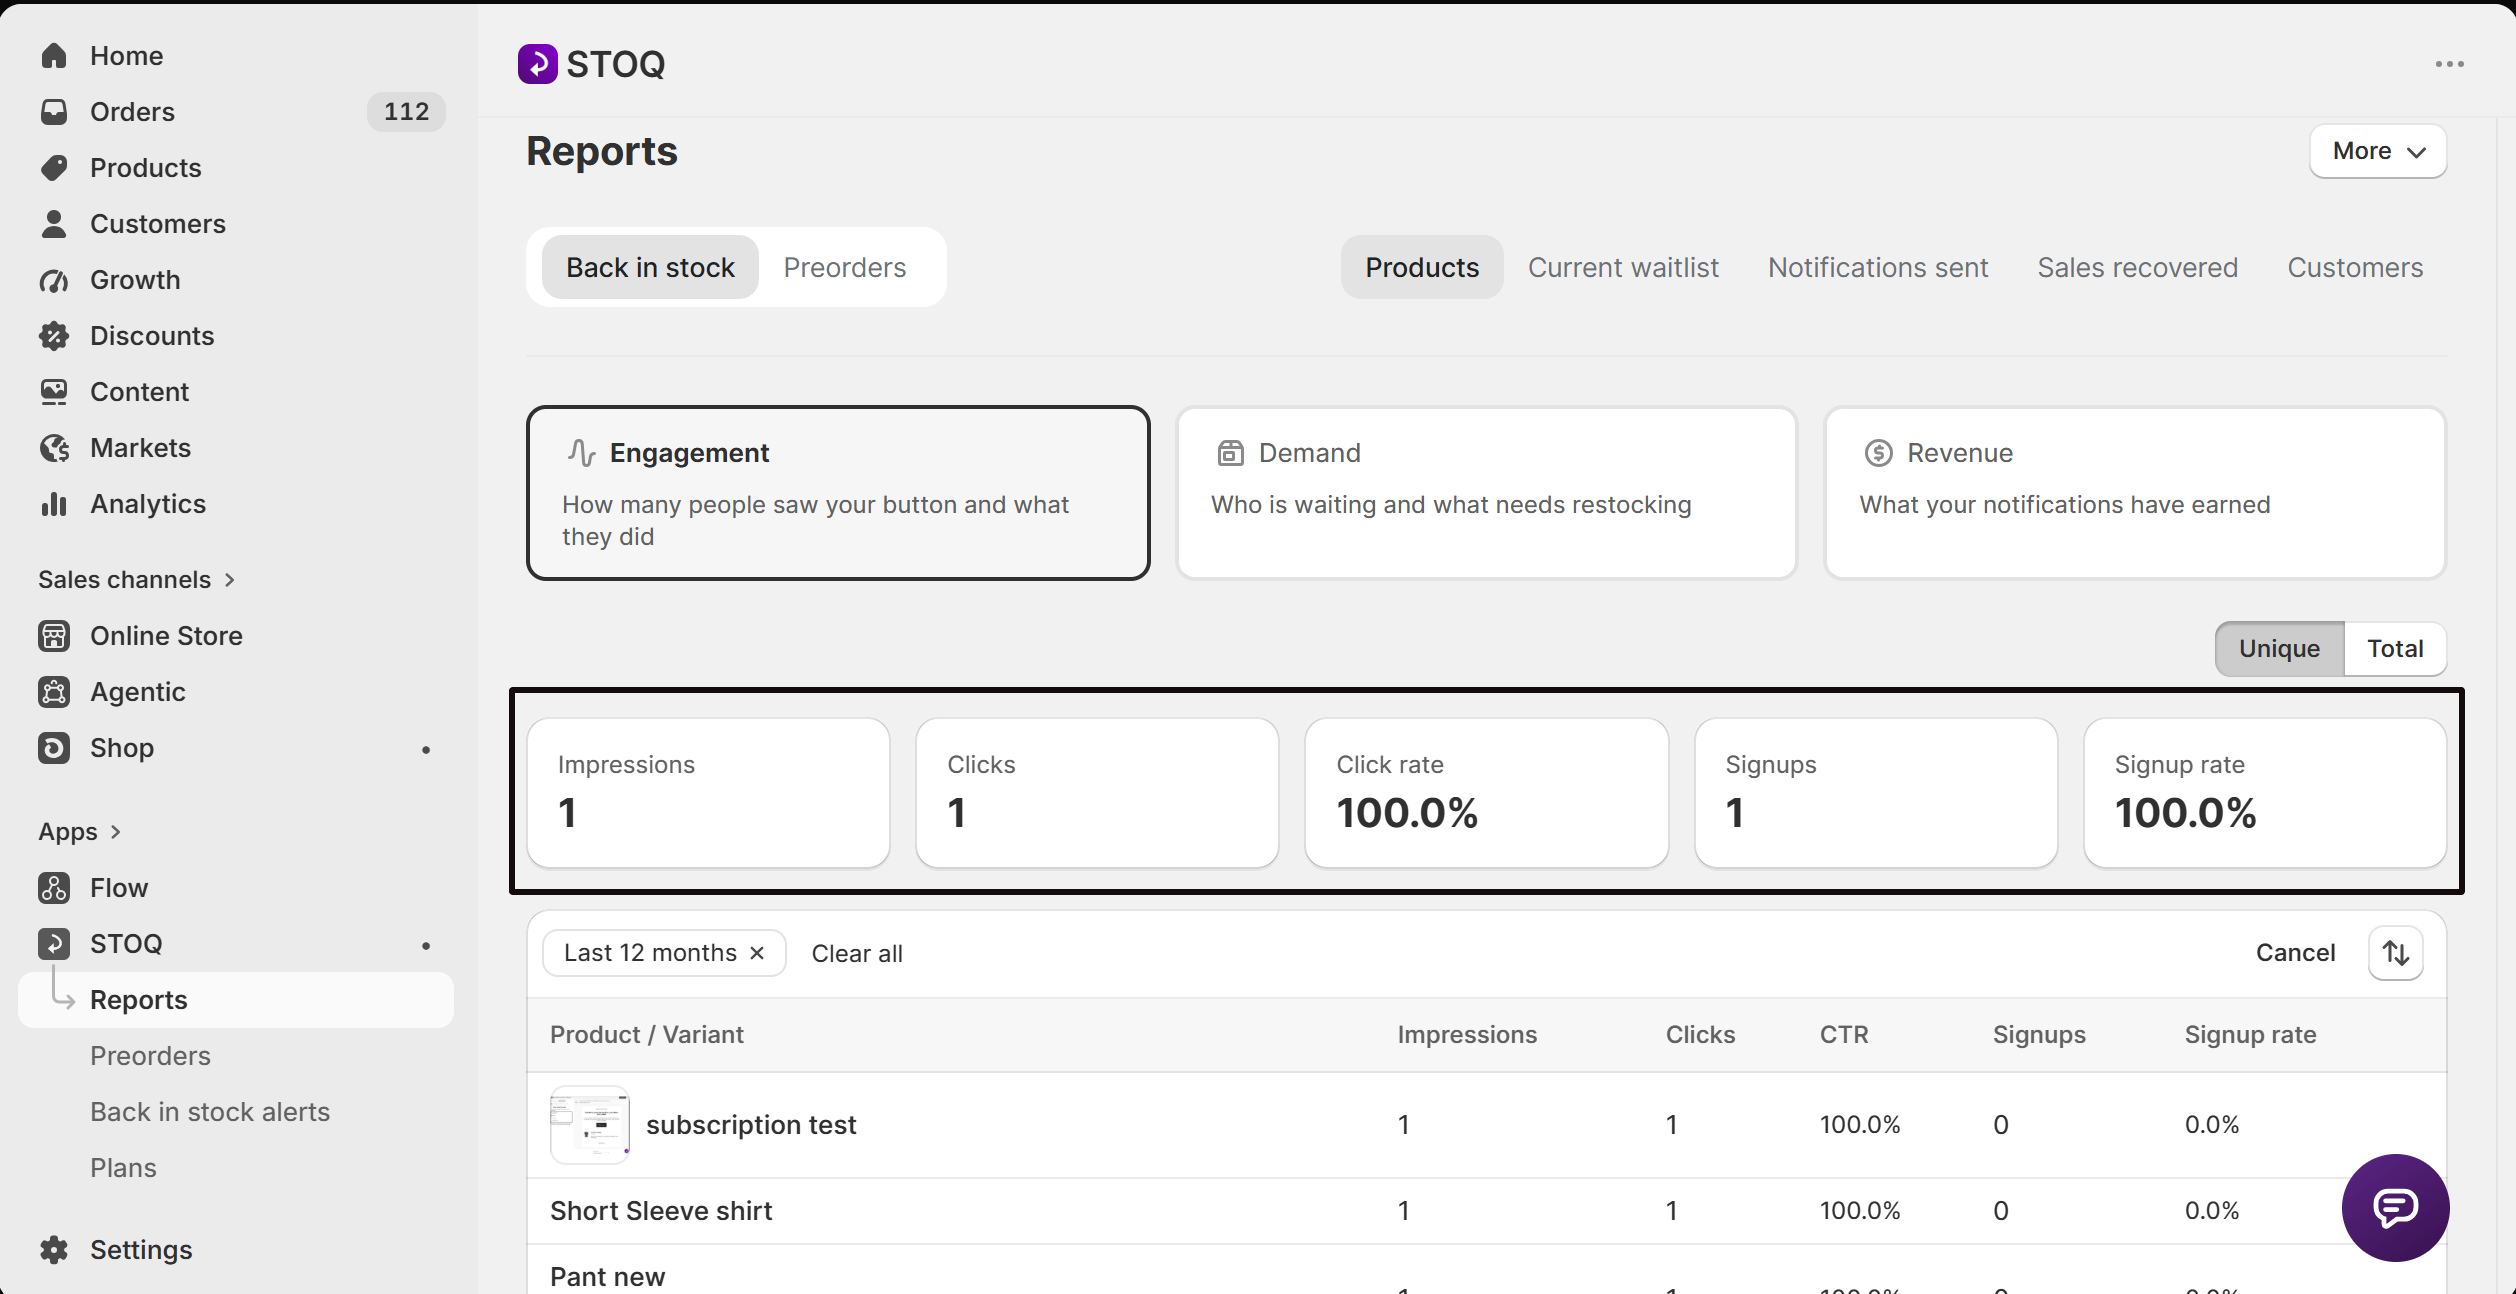
Once analytics is active, five summary cards span the whole funnel: Impressions, Clicks, Click rate, Signups, and Signup rate. Signup rate is calculated against clicks, not impressions, so it shows how many shoppers who clicked the button went on to sign up.
At the top of the view, a Unique / Total toggle switches every metric on the page, summary cards and the table below, between counting each customer once (Unique) or counting every occurrence (Total). Use Unique to see how many distinct shoppers you reached, and Total to see overall volume.
Below the summary cards, a table lists every product and variant with its own Impressions, Clicks, CTR, Signups, and Signup rate. Click the sort control above the table to order rows by any of those metrics, high to low or low to high, the default is Impressions, high to low.
Filter your data
Above the table you can filter by:
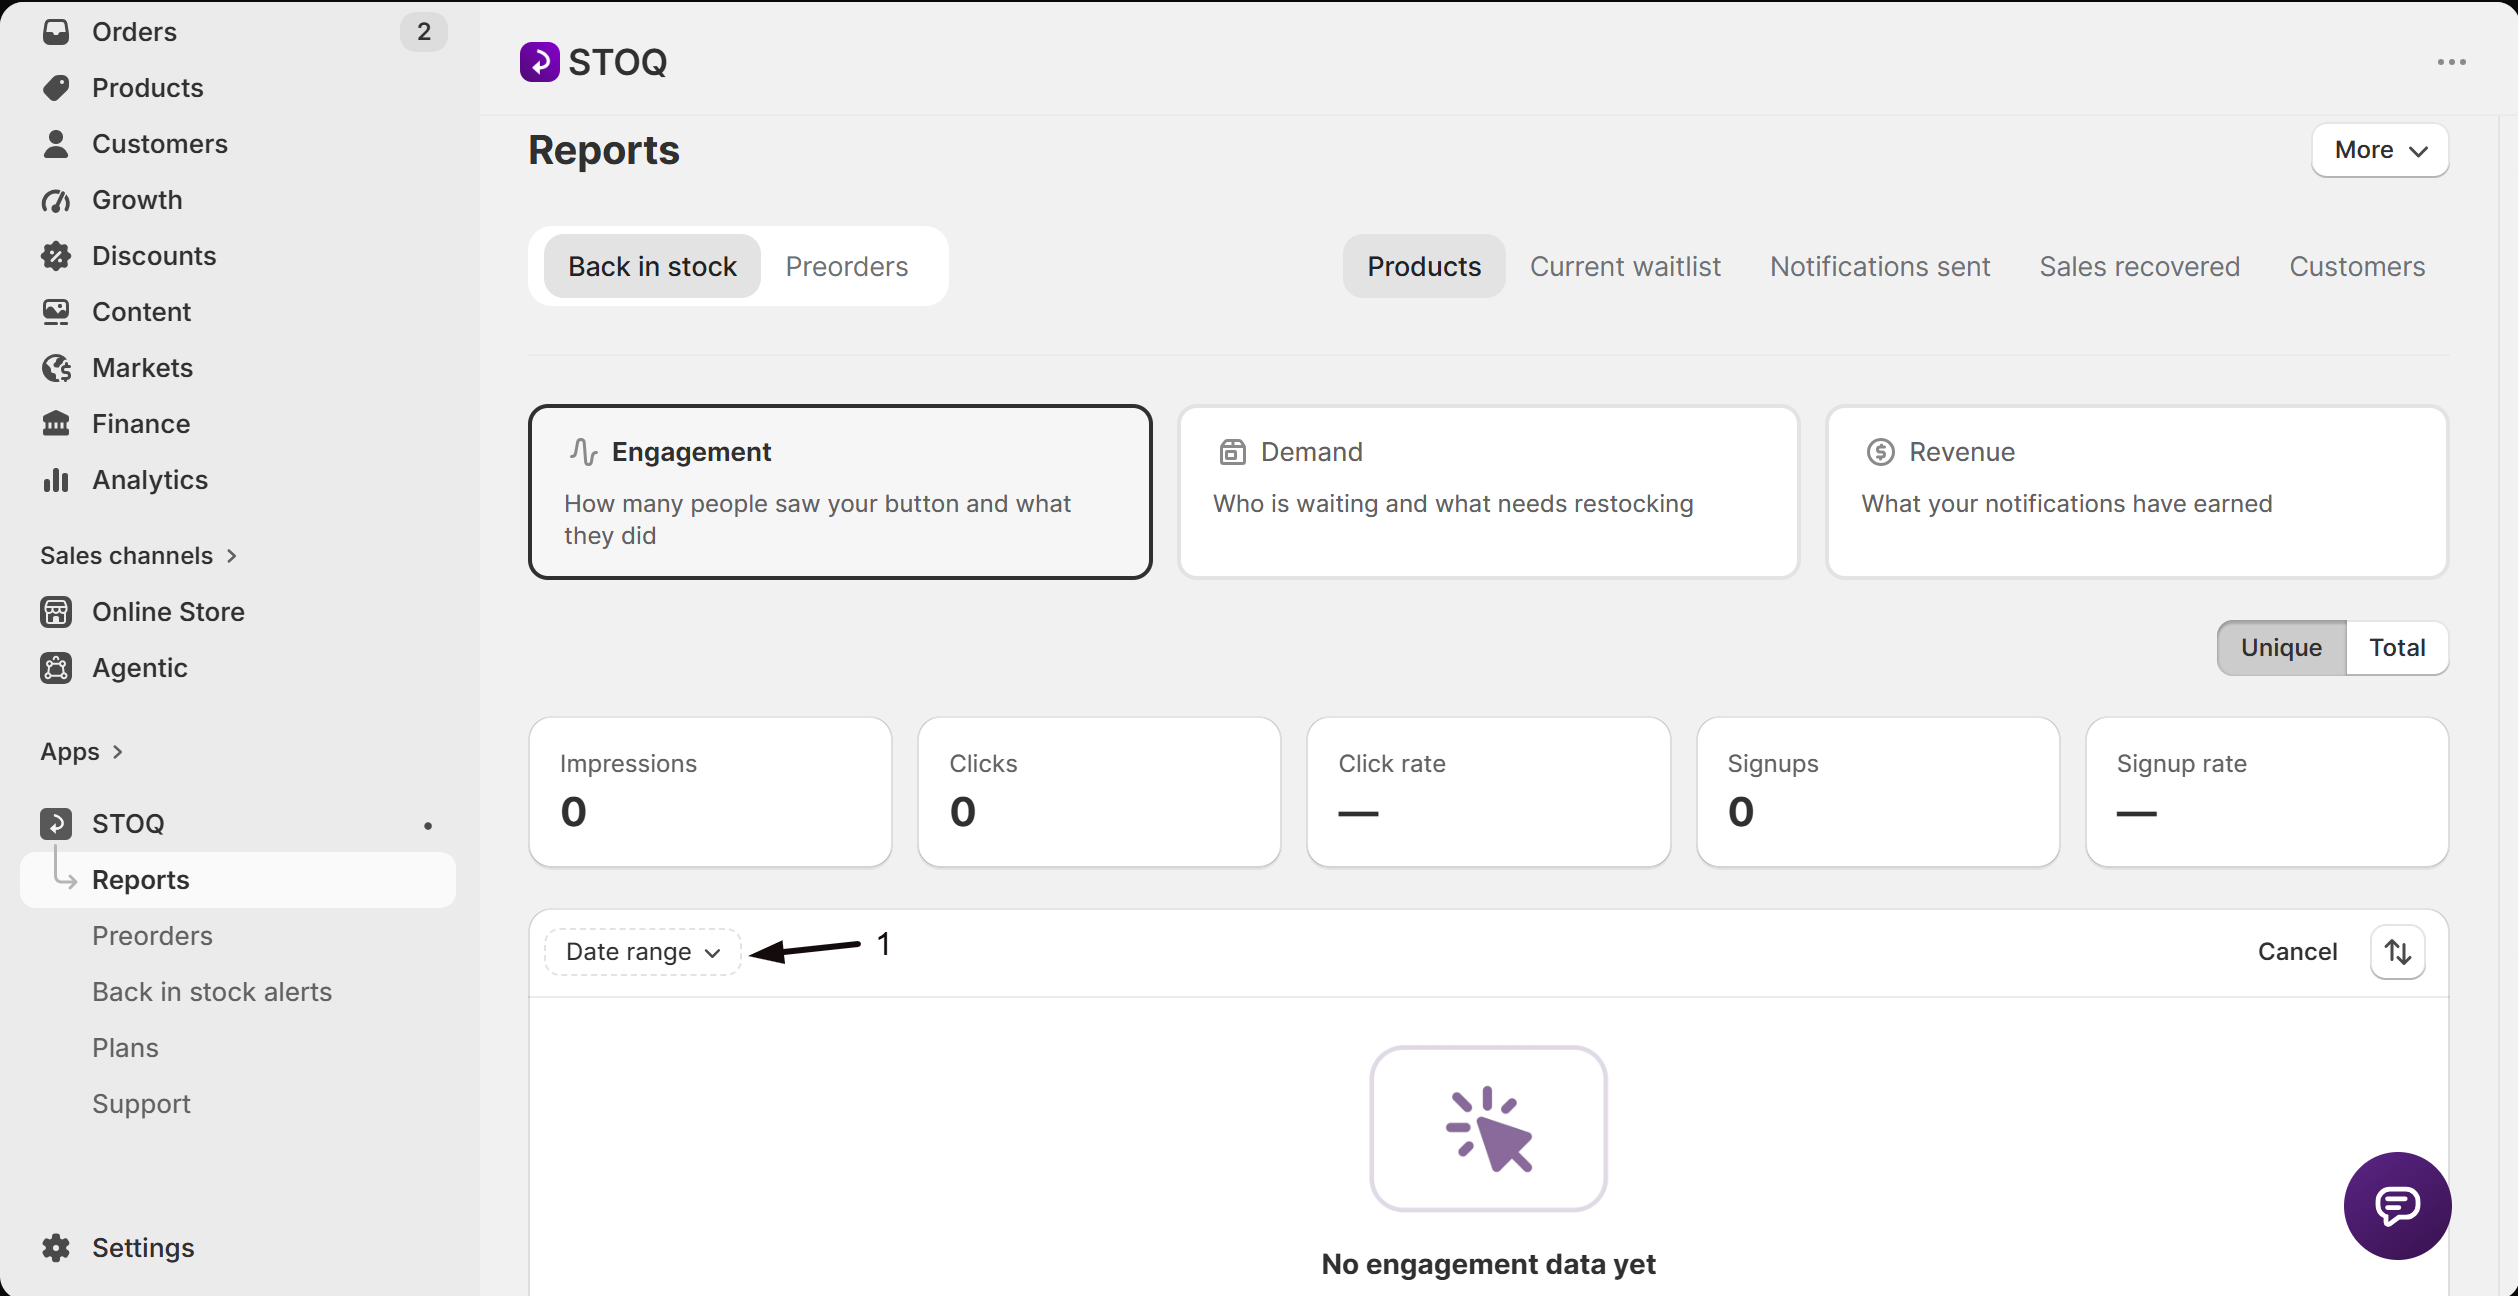
- Date range: Last 7 days (the default), Last 30 days, Last 60 days, Last 90 days, Last 6 months, Last 12 months, or Custom. Choosing Custom opens a date picker, pick a start and end date and click Filter to apply.
- Market: only shown if your store has more than one market. Choose All markets or a single market to narrow the data.
Applied filters show as removable chips; clear one from its chip, or use the clear-all control to reset back to Unique, Last 7 days, and no market filter.
Troubleshooting
- If you still see sample data marked "Sample data": analytics hasn't been turned on yet. Click Enable analytics on the Engagement view.
- If you see "No engagement data yet": your Notify me button hasn't recorded any views in the selected date range yet. Try a wider date range, or wait for storefront traffic.
- If you don't see a Market filter: it only appears once your store has more than one market set up.
FAQ
What does the analytics pixel actually track?
Button impressions, clicks, and signup submissions on your Notify me button, captured through Shopify's Customer Events API. It doesn't record personal data.
Does turning on analytics change anything customers see?
No. Enabling analytics doesn't change your Notify me button or anything else on your storefront, it just starts recording anonymized impression, click, and signup events so you can see the funnel in Reports.
Will I see historical signups once I turn analytics on?
No. The Engagement view only shows activity from when you enable analytics onward, past button views and signups aren't recorded retroactively.
What's the difference between Unique and Total?
Unique counts each customer once no matter how many times they saw or clicked the button; Total counts every occurrence. The toggle at the top of the Engagement view switches both the summary cards and the table between the two.
Why is my signup rate lower than my click rate would suggest?
Signup rate is calculated against clicks, not impressions, so it measures how many shoppers who already clicked the button went on to sign up, not how many of all shoppers who saw it did.
Can I export the Engagement view to CSV?
Not directly. Unlike the Demand and Revenue views on the Products tab, Engagement doesn't have a CSV export button.
Related guides
View your reports
See what each Back in stock report tab shows, including the Products tab's Demand and Revenue views.
Manage a product's waitlist
Use the Demand view to see who's waiting on a product and act on it.
Export your reports
Email a CSV of your other Back in stock reports.
Report settings
Set the email address your report exports and alerts are sent to.